The Alligator Graph and the Death of Attribution: Why Marketers Must Embrace Lift-Based Measurement
The Alligator Graph and the Death of Attribution: Why Marketers Must Embrace Lift-Based Measurement
Christina Adame, President of SEO • Intero Digital • July 28, 2025

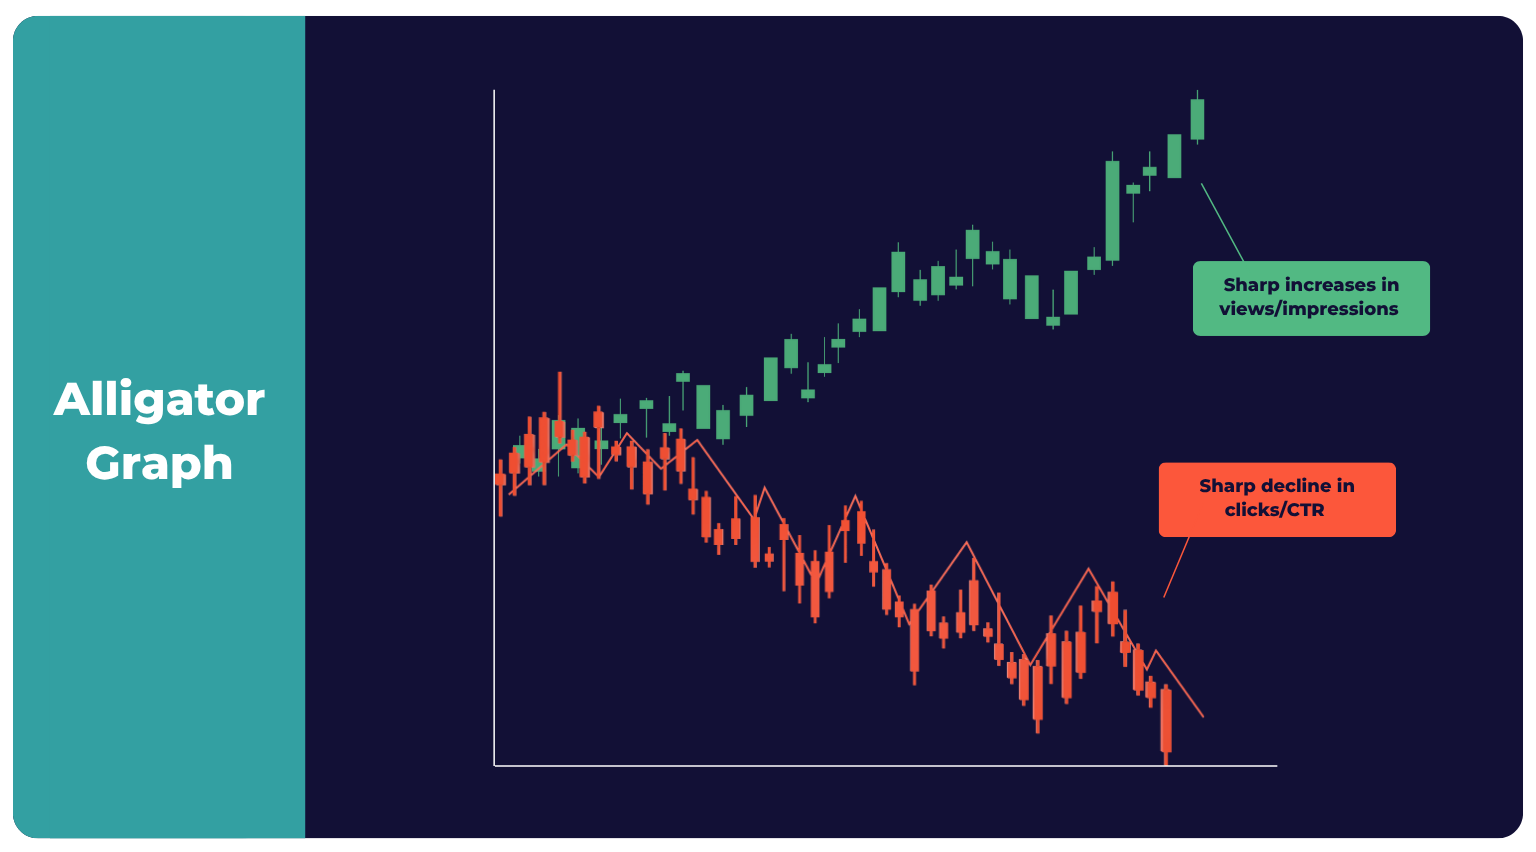
If you’ve seen Rand Fishkin’s trending breakdown, you know the story: Impressions are climbing, clicks are dropping, and traditional attribution models are falling apart. Marketers everywhere are watching the alligator’s jaws widen with one line trending up (visibility) and the other sinking (click-throughs).
Welcome to the zero-click era and the emergence of the “alligator graph.”
What Is the Alligator Graph?

The alligator graph visualizes a frustrating reality: Your content is seen more often but clicked less frequently. That’s because platforms — from Google to LinkedIn to AI tools like ChatGPT — increasingly serve answers on-platform, which eliminates the need for users to click through.
Take a look at your Google Search Console dashboard and you’ll probably see something like this:
- Impressions steadily increasing
- Clicks plateauing or declining
- Click-through rate trending down
Here’s an example from one of our clients:

This isn’t a one-off anomaly. It’s the new normal.
Why Attribution Is Failing
Attribution models — first click, last click, linear, you name it — were already shaky. But 2025 has made them nearly impossible to use.
Here’s why:
- Cookie deprecation and privacy changes make it harder to track users across sessions.
- AI search and LLMs provide answers directly in the interface, no click necessary.
- Dark social and app data walls hide full user paths.
- Multidevice behavior breaks traditional user journey tracking.
What Should We Look at Instead of Attribution?
Rand’s recommendation — and one that’s increasingly echoed by the smartest minds in marketing — is to move from attribution to lift.
Instead of asking, “Where did this conversion come from?” ask, “Did our marketing efforts create a measurable increase in key business metrics?”
How Lift-Based Measurement Works
Here are two examples of what lift-based measurement might look like.
Traditional A/B: Two billboards, two similar markets, different messaging. Which drove more same-store sales?
Digital: Launch a branded content series and measure changes in branded search volume, direct traffic, email signups, social engagement, and demo requests.
You’re not tracing a single path. You’re tracking impact over time.
Funnels Still Matter, Just Not the Way You Think
The buyer’s journey continues to evolve and become less linear. But the funnel stages still offer structure that allows marketers to provide value throughout buyers’ path to purchase.

Mapping lift across each stage helps visualize the cumulative effect of your efforts, even when clicks don’t show it.
What Metrics Should You Actually Track?
We’ve touched on why attribution is broken. But where do we go from here?
Focus less on journeys and more on presence to determine:
- Where are we being seen?
- Where are we influencing behavior?
To answer these questions, we can look at things like exposure, engagement, interest, and conversions. Every organization’s specific metrics will vary, but here’s a baseline to align your team around:
Exposure
- LinkedIn impressions
- Google AI Overviews appearances
- Podcast listens or YouTube views
Engagement
- Replies and comments
- Brand name mentions
- Follows and email list growth
Interest
- Branded search queries
- Product page views
- Time on site
- Return visitors
Conversions
- Demo requests
- Free trial signups
- Purchases
The SEO + GEO Connection: Why This Matters Now More Than Ever
This shift doesn’t just change how we measure results; it redefines where we invest.
Traditional SEO alone is no longer enough. As we detailed in our guide to integrating SEO with generative engine optimization (GEO), search success now depends on visibility across AI-powered tools and generative experiences, not just blue links on Page 1.
Impressions ≠ vanity. In a world where AI summarizes, recommends, and influences next steps, being visible is being influential, even if you don’t get the click.
As zero-click search becomes the norm, marketers must embrace retrievability, the ability for AI and LLMs to find and surface your brand when it matters most.
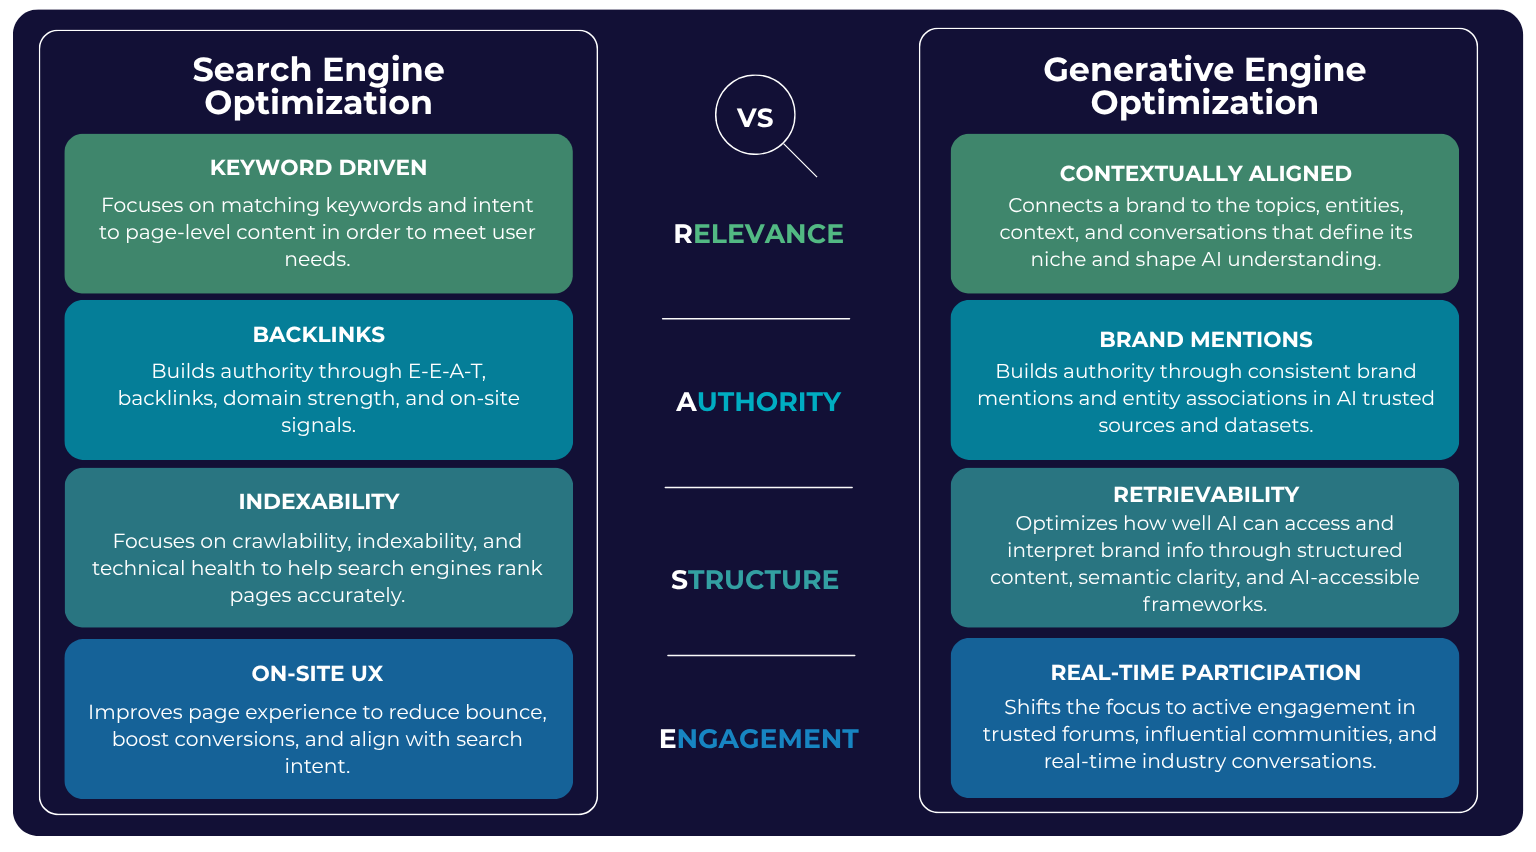
That’s where our RASE framework comes in. It outlines four pillars that define what it takes to be visible in an AI-first search landscape.

Optimizing for GEO through the RASE framework means redefining what it means to succeed in search:
- Relevance is about meaning, not just matching.
- Authority comes from context, not just backlinks.
- Structure facilitates understanding, not just indexing.
- Engagement is earned in public discourse, not just on-site journeys.
Without optimizing for retrievability, even the best content can become invisible to AI.
Bottom Line: Lift Is the New Attribution
The alligator graph doesn’t just reflect a change in user behavior. It’s a call to action for marketers.
Stop obsessing over click-throughs. Start focusing on:
- Visibility over vanity.
- Trend lines over traffic drops.
- Brand presence over breadcrumbs.
The marketers who will win in the next era are those who accept attribution’s death and learn to measure what moves the needle through lift-based frameworks.
Tips for Getting Started
- Track branded search volume week over week.
- Monitor direct and return visitors via GA4.
- Use regex filters to catch AI tool traffic in analytics:(.*gpt.*|.*chatgpt.*|.*openai.*|.*perplexity.*|.*gemini.*|.*bard.*|.*copilot.*).
- Watch AI platforms for citations and mentions.
- Map lift across funnel stages using your own KPIs.
You can’t prove marketing value with a broken map. But you can track momentum.
Let the alligator graph serve as a warning and a road map. Attribution may be dead, but impact isn’t. It just looks different now.
So update your dashboards, realign your KPIs, and build your strategy around visibility, retrievability, and lift.
That’s how we win in the age of zero-click search.
